






 Note Wisdom
Minimalist Macaron Academic Template: A Soft Visual Framework for Feline-Themed Scholarly Research
Design a soothing academic presentation using macaron pastels and cute cat photography. This framework balances scholarly structure with approachable visuals, ideal for researchers seeking a friendly, engaging narrative tone for complex data summaries.
- Download this PPT
- Commercial use (1 project)
- Present publicly
1. Main Design Philosophy
-
Core Idea: "Softened Academia." The design philosophy centers on stripping away the cold, rigid, and often intimidating nature of traditional academic presentations, replacing it with a warm, approachable, and visually soothing framework.
-
Conceptual Metaphor: The presentation acts as a "cozy research lounge." The realistic yet adorable kittens serve as empathetic companions, guiding the audience through complex academic data with a calming presence.
-
Narrative Direction & Emotional Tone: The narrative is structured, methodical, yet gentle. It evokes feelings of calm, clarity, and intellectual curiosity, avoiding the anxiety often associated with dense data reviews.
-
Audience Insight & Intended Perception: The target audience includes students, young researchers, or educators in soft sciences, humanities, or pet-related fields. They should perceive the content as academically rigorous yet highly accessible and emotionally intelligent.
-
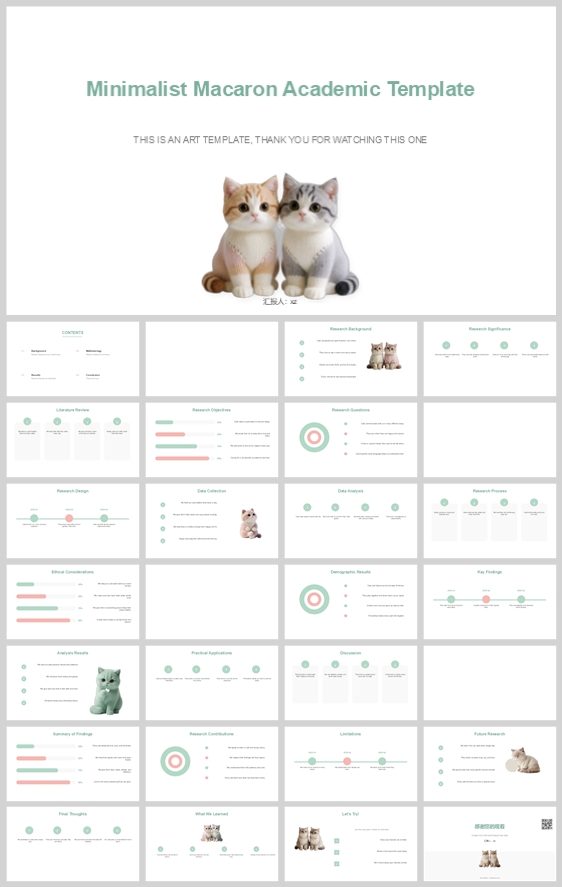
Why This Philosophy Fits: The thumbnail features a very strict academic structure (Literature Review, Methodology, Data Analysis) paired with fluffy, high-resolution kitten imagery and pastel macaron colors. This demands a philosophy that respects academic hierarchy while prioritizing emotional comfort.
-
How It Guides Design: This philosophy dictates the use of pastel analogous colors, strict but spacious grid systems, and the strategic placement of high-quality cat imagery to break up text-heavy slides.
2. Color System
-
Why This System: The "Macaron" palette was chosen to lower the audience's cognitive guard. Soft, low-contrast pastels reduce eye strain and psychological stress during long presentations.
-
Color Psychology & Emotional Meaning: Mint green represents growth, clarity, and calmness. Soft blush pink evokes warmth, care, and creativity. Cream white provides a clean, neutral canvas that promotes focus.
-
Primary Palette:
-
Mint Green (Headers, primary charts):
#9DC1B3 -
Creamy Off-White (Backgrounds):
#FDFBF7
-
-
Secondary Palette:
-
Blush Pink (Secondary charts, highlights):
#F2D5D5 -
Soft Sage (Subtitles, secondary text):
#B4C4B9
-
-
Accent Palette:
-
Muted Dark Teal (Primary text, high contrast):
#3A4A42 -
Warm Beige (Card fills, quote blocks):
#F5EFEB
-
-
Color Pairing Logic & Harmony: The palette uses harmonious analogous colors (green and pink) balanced by neutral creams. The low saturation prevents visual fatigue.
-
Color Proportion & Balance: 60% Cream (background and negative space), 30% Mint/Pink (charts, structural elements, headers), 10% Dark Teal (text and critical data labels).
-
Background-to-Foreground Layering: The cream background acts as the foundational layer. Soft beige and pastel pink rounded rectangles group related content. Mint green lines and dark teal text create the final, readable layer.
-
Contrast, Readability, & Accessibility: Dark teal text (
#3A4A42) on the cream background (#FDFBF7) provides high contrast, ensuring excellent readability for dense academic text. -
Semantic Use of Color: Mint green indicates active data, progress, and primary headers. Blush pink is used for highlights, comparative data, and secondary focal points. Dark teal is strictly used for body copy and essential data labels.
-
How It Supports the Theme: The pastel tones directly mirror the soft fur and gentle lighting in the kitten photos, creating perfect visual cohesion.
3. Visual Elements
-
Why These Elements: To humanize academic content and maintain visual interest across a multi-slide research deck without relying on sterile stock photography.
-
Illustration Style & Mascot Direction: High-resolution, softly lit photography of kittens. The cats are depicted in various relatable poses (sitting together, looking curious, sleeping). The high quality of the photos elevates the "cute" factor to a professional, aesthetic standard.
-
Iconography Style: Thin-line icons (1.5px to 2px stroke) with rounded caps. Icons use a single color (Mint Green or Soft Sage) and are often enclosed in circular or rounded-square outlines to maintain consistency.
-
Shape Language & Geometric Motifs: Extensive use of rounded rectangles for content blocks. Dashed lines are used for framing and timeline connections. Concentric circles and bullseye targets (as seen in the "Research Questions" and "Summary of Findings" slides) are used to visualize focus and data.
-
Texture, Materiality, & Lighting: The layout relies on flat vector graphics with a matte finish. The contrast comes from the highly realistic, soft-lit photography of the kittens, creating a "tactile" digital experience.
-
Decorative Elements & Framing: Minimalist. Floating dots, soft shadows under the cards, and subtle line dividers serve as accents to fill negative space without adding clutter.
-
Repetition, Rhythm, & Consistency: Every slide uses the same top-left title placement, consistent card padding, and identical illustration proportions.
-
How Each Element Improves Engagement: The kittens serve as memorable visual anchors, making the deck instantly recognizable. The consistent use of rounded shapes and thin icons reduces cognitive load, making complex academic data feel effortless to process.
4. Layout & Typography
-
Why This Layout: To ensure the presentation is easily scannable and maintains a predictable rhythm, allowing the audience to focus on the research data rather than navigating the design.
-
Grid System & Alignment Logic: A strict 12-column grid system. Text is always left-aligned to create a clean vertical axis. Multi-column layouts (2, 3, or 4 columns) are used consistently for data comparison or feature lists.
-
White Space Strategy: Generous padding (minimum 40px margins on all sides). White space is treated as an active design element, preventing information overload and providing visual breathing room between dense data sets.
-
Visual Hierarchy & Focal Point Planning: Every slide has a clear focal point: the title, a hero kitten photo, or a key data visualization (like the bullseye). The eye is guided from the large title (top left) to the main visual, then to the supporting text.
-
Reading Flow & Eye-Path Direction: Standard Z-pattern for title slides and F-pattern for content slides. Timelines and progress bars provide a clear left-to-right horizontal flow.
-
Font Pairing & Type Scale:
-
Headings:
MontserratorQuicksand(Rounded, modern sans-serif, 28-36pt, Semi-Bold). -
Body:
InterorOpen Sans(Clean, highly legible sans-serif, 14-16pt, Regular).
-
-
Weight, Spacing, & Line Height: Headings are Semi-Bold (600), body is Regular (400). Body text line height is set to 1.5 for optimal readability in academic contexts.
-
Consistency Rules: Titles always appear in the same top-left position. Page numbers appear in the bottom right. The specific mint green color (
#9DC1B3) is exclusively used for all main titles. -
How Layout Improves Clarity: The structured grid and generous spacing prevent clutter, ensuring that even dense academic literature reviews and demographic results remain accessible and professional.
5. Design Goal
-
Design Goals: To create a presentation that feels like a supportive academic mentor rather than a daunting evaluator. To make a "Research Summary" approachable and memorable.
-
Appropriateness for Audience: Ideal for graduate students, early-career researchers, or anyone presenting at a conference where audience engagement and reducing cognitive fatigue are prioritized.
-
Intended Emotional Impact: The audience should feel relaxed, engaged, and positively inclined toward the presenter and the research.
-
Communication Objectives: To clearly convey research methodology, data analysis, and findings while maintaining a distinct and charming brand identity.
-
Desired Audience Response: Increased attention retention, positive association with the research topic, and a sense of connection to the presenter.
-
How Design Balances Aesthetics & Delivery: The strict grid ensures message delivery is never compromised, while the kitten imagery and macaron palette ensure the aesthetics elevate the message rather than distract from it.
6. Design Principles and Consistency Checklist
-
Key Principles:
-
Softened Rigor: Strip away the coldness of academia, but keep the structural integrity.
-
Visual Anchoring: Every slide should have a visual resting point (the cat or a bold data chart).
-
Structured Calm: Use strict grids but soft pastel colors and rounded shapes.
-
-
Reusable Rules:
-
Never use pure black (
#000000) or pure white (#FFFFFF); use dark teal and cream. -
Maintain a consistent border radius (e.g., 12px) on all cards and images.
-
Ensure all icons have the same stroke weight (2px).
-
Always left-align body text and bullet points.
-
Keep the cat photography realistic but soft; avoid overly cartoonish or clip-art styles.
-
Conclusion
This design concept successfully transforms a standard academic research template into an engaging, heartwarming visual journey. By leveraging a macaron pastel color palette, strict grid layouts, and charming high-resolution kitten photography, the deck achieves a rare balance between scholarly credibility and cozy approachability. The consistent application of rounded shapes, careful typography, and ample white space ensures that complex academic data is delivered with clarity, empathy, and a distinct, memorable brand personality.
Article + Bundle Download